Predicting the weather is not a trivial matter when traversing multiple continents over the course of more than a year. We need to have an idea of what the temperature will be to make sure we have enough warm things. And, almost as importantly, to make sure we’re not carrying around unnecessary clothing (weight savings!).
At many weather sites you can search for a city and then look up the monthly temperature averages, but this is cumbersome. I don’t have a list of cities handy, and my understanding of the geography for the entire trip is limited. I was recently introduced to WeatherSpark.com and now I’m a big fan. It doesn’t just give you weather averages, but makes pretty graphs and has a ton of features. Check out this screenshot.
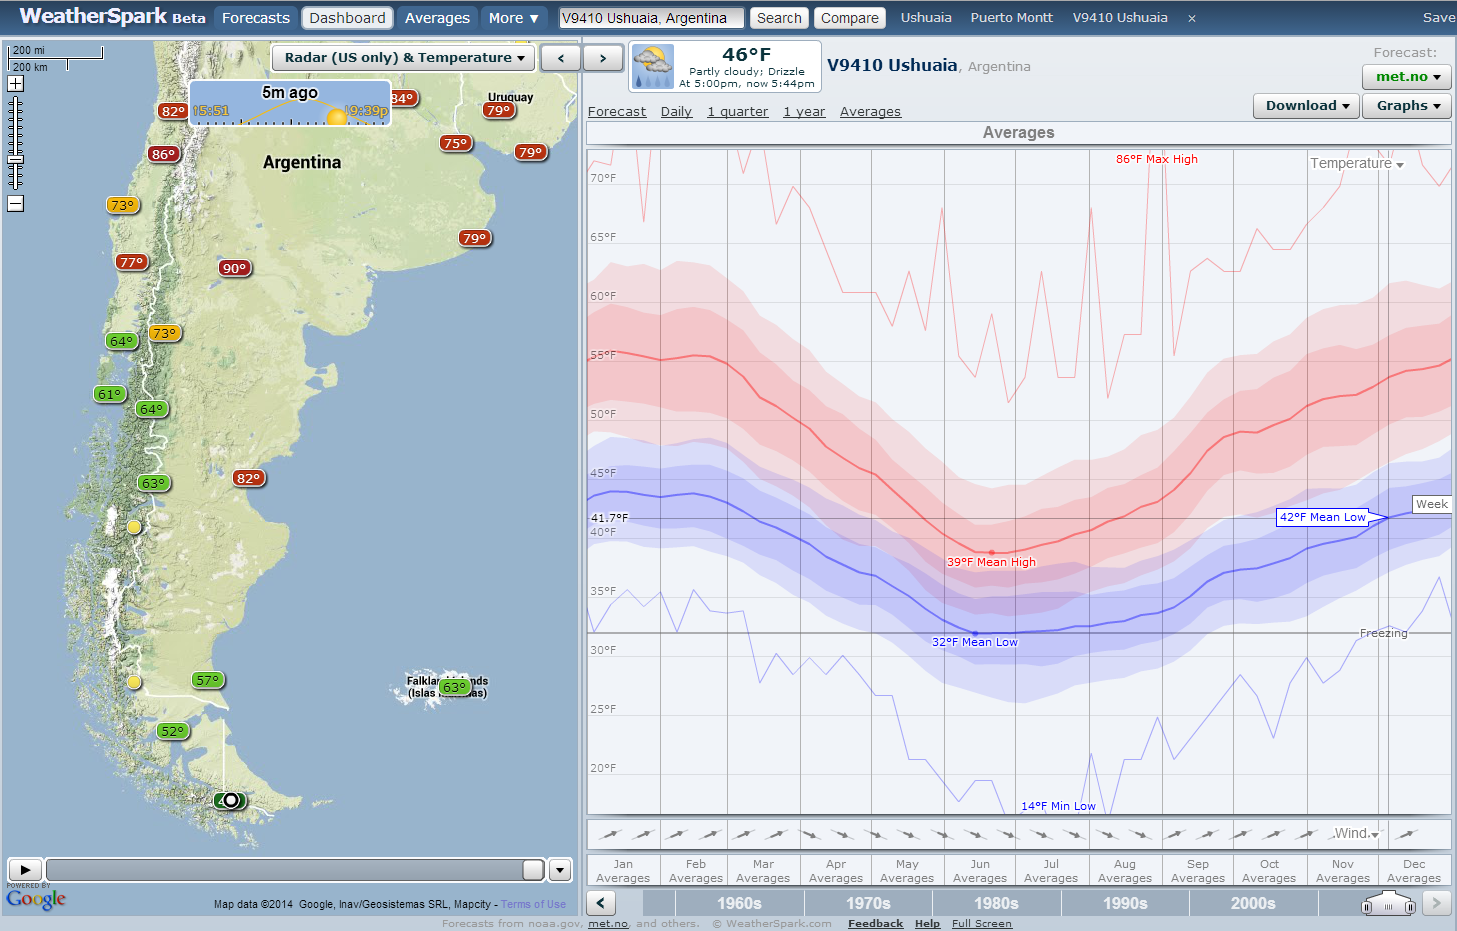
Map of weather stations and temperature averages from WeatherSpark.com. Note the range of highs (reds) and lows (blues). Weather is highly variable!
Recently I planned a rough guess of the countries and the month we might pass through. Then, I powered up WeatherSpark to see which cities there were data for. Not only can I navigate easily between cities (and even know which cities there are data for), I can plot yearly curves of temperature. And they aren’t just average temperatures, but a distribution. This is very important, since temperatures tend to be highly variable! Needless to say, I am impressed.
Soon after I realized you could plot about 15 different weather variables and I got more excited. As a cyclist, the main weather concern is temperature. However, rainfall (or, dare I say it, snow!) and strong headwinds are definitely worth watching out for. When you’re outside almost the entire day, you want to make sure you will be comfortable.
OK. I’m done raving about the website; let’s look at what information I gathered.
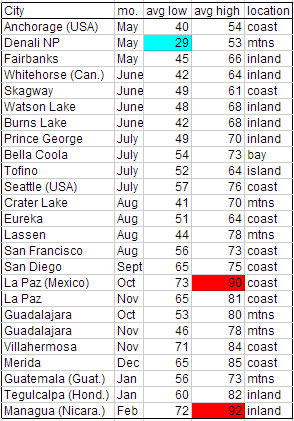
Average temperatures for the first half of the trip.
Our start date is fixed because we already bought airplane tickets. It looks like it will be pretty cold in Denali NP, at 29°F (-2°C) for the average low in May. Brrr. But, we knew that already, and we bought some warm sleeping bags and other gear for the cold weather. We’ll keep our fingers crossed that a cold snap doesn’t hit while we’re there!
The next thing I was curious about was Mexico. We don’t want to get there too soon and be roasted as we travel through the desert down the Baja California peninsula. It looks like it will be a toasty 90°F (32°C) for the average high in October! Honestly, this wasn’t as bad as I was expecting. That is probably because La Paz is on the coast. In any case, it will still encourage us to spend a little more time in the US to wait out the hot summer temperatures.
What I really didn’t know about was what the weather would be like way down south – for the last couple months nearing Ushuaia. The good news is that it should be right on par with the temperatures at the start of our trip, in Alaska and Yukon. Lows near 40°F (4°C) are quite bearable when camping. (Or you can at least agree that we will have tested our gear already to know!)
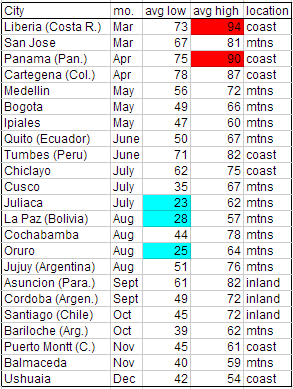
Average temperatures for the second half of the trip.
The big surprise for me was how cold the nights will be in the high elevations in Peru and Boliva. We’re talking about places only about as far south of the equator as the Yucatan peninsula is north of the equator. The average lows are below freezing in places like Juliaca, Peru (12,549’, 3825 m), La Paz, Boliva (11,913’, 3631 m), and Oruro, Bolivia (12,159’, 3709 m). Who knows how cold it will get on other mountain passes — where there wasn’t temperature data for me to look up. Hopefully not much colder, but I guess we’ll find out next year!